Licensed agents can review private health plans year-round. Marketplace coverage is one path, with official open enrollment dates and public premium research published each year. This index restates those official Marketplace averages, and official enrollment counts, so journalists, advisors, and people shopping for individual coverage can see how they changed by state.
Official 2027 Marketplace Open Enrollment dates (HealthCare.gov): November 1, 2026 through January 15, 2027. On HealthCare.gov, December 15 is the last day to enroll for coverage that starts January 1. State-based Marketplaces can set different dates, so check your state's Marketplace. See the state-by-state deadline table. Download these dates as a calendar file.
Key findings from KFF's 2027 figures
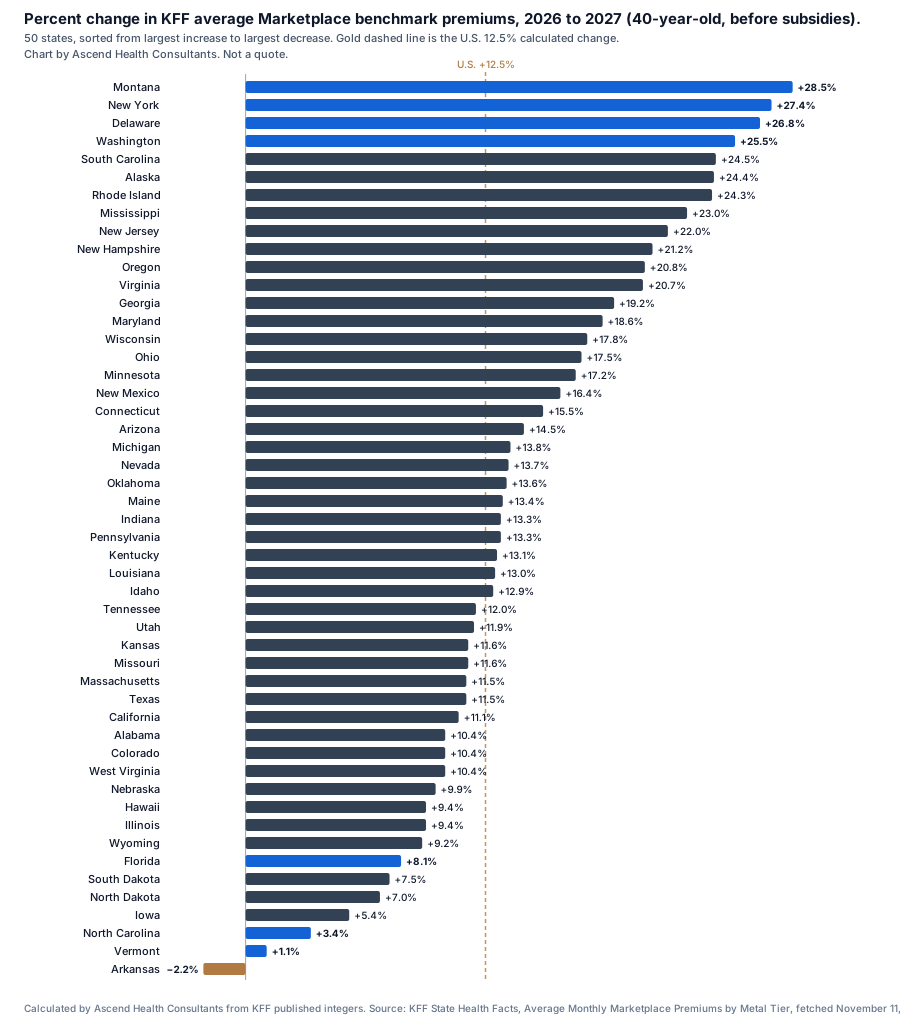
- The KFF average U.S. Marketplace benchmark premium for a 40-year-old, before subsidies, is $703 a month in 2027, compared with $625 in 2026. That is a $78 change, or 12.5%, calculated from KFF's published integers: (703 − 625) ÷ 625. KFF's November 6, 2026 brief, 9 Things to Watch for the 2027 ACA Open Enrollment Period, describes the average increase as 13%. That brief was corrected the same day for Oregon and California (the national benchmark was corrected from $704 to $703). This page uses 12.5%, calculated from the corrected published integers. Sources: KFF, Average Monthly Marketplace Premiums by Metal Tier (fetched November 11, 2026; KFF correction dated November 6, 2026); KFF, 9 Things to Watch for the 2027 ACA Open Enrollment Period (published/corrected November 6, 2026).
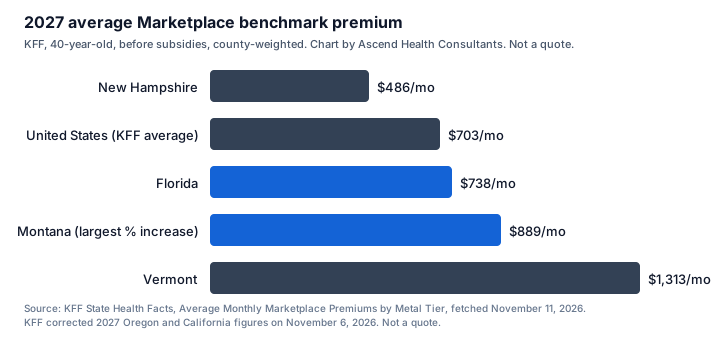
- Florida's average benchmark is $738 in 2027, compared with $683 in 2026, a $55 or 8.1% change. That percentage is below the national 12.5% change. Among the 50 states, 43 had a larger percentage increase. Florida's 2027 average benchmark ranks 16 of 50 states, from highest to lowest. Source: same KFF metal-tier table; ranks and percentages calculated from KFF's integers. Verified November 11, 2026.
- The lowest 2027 state average benchmark in KFF's table is $486 in New Hampshire. The highest is $1,313 in Vermont. Source: same KFF metal-tier table.
- The largest percentage increase in the average benchmark among the 50 states is 28.5% in Montana ($692 to $889). Only Arkansas had a lower average benchmark in 2027 than in 2026 ($774 to $757, −2.2%). Source: same KFF metal-tier table; percentages calculated from the published integers.
- KFF's published U.S. average for the lowest-cost gold plan in 2027 is $694, which is below the U.S. average benchmark of $703. Those two figures are averaged separately across counties and states, so this is not a claim that a gold plan costs less than the benchmark silver plan in any given county. See the methodology. Source: same KFF metal-tier table.
- From 2025 to 2027, KFF says ACA Marketplace benchmark silver premiums increased 42% on average. KFF's published U.S. averages for a 40-year-old, before subsidies, are $497 in 2025, $625 in 2026, and $703 in 2027. Calculated from those integers, the 2025-to-2026 change is 25.8% and the 2025-to-2027 change is 41.4%. This page reports KFF's published “42%” as KFF's figure, and 41.4% as the calculation from the integers, the same way the 2026-to-2027 change is reported as 12.5% rather than the brief's “13%.” The same brief says HealthCare.gov states' 2027 benchmark premiums are increasing 11%, and states that run their own enrollment platforms are seeing 16%. KFF also reports that insurers estimated risk-pool changes after the enhanced-credit expiration added about four percentage points on average to premiums in 2026 and expect a similar, additional effect in 2027 — cited here as KFF's analysis of insurer filings, not as a measured premium. Sources: KFF, Average Monthly Marketplace Premiums by Metal Tier (2025, 2026, and 2027 columns); KFF, 9 Things to Watch for the 2027 ACA Open Enrollment Period.
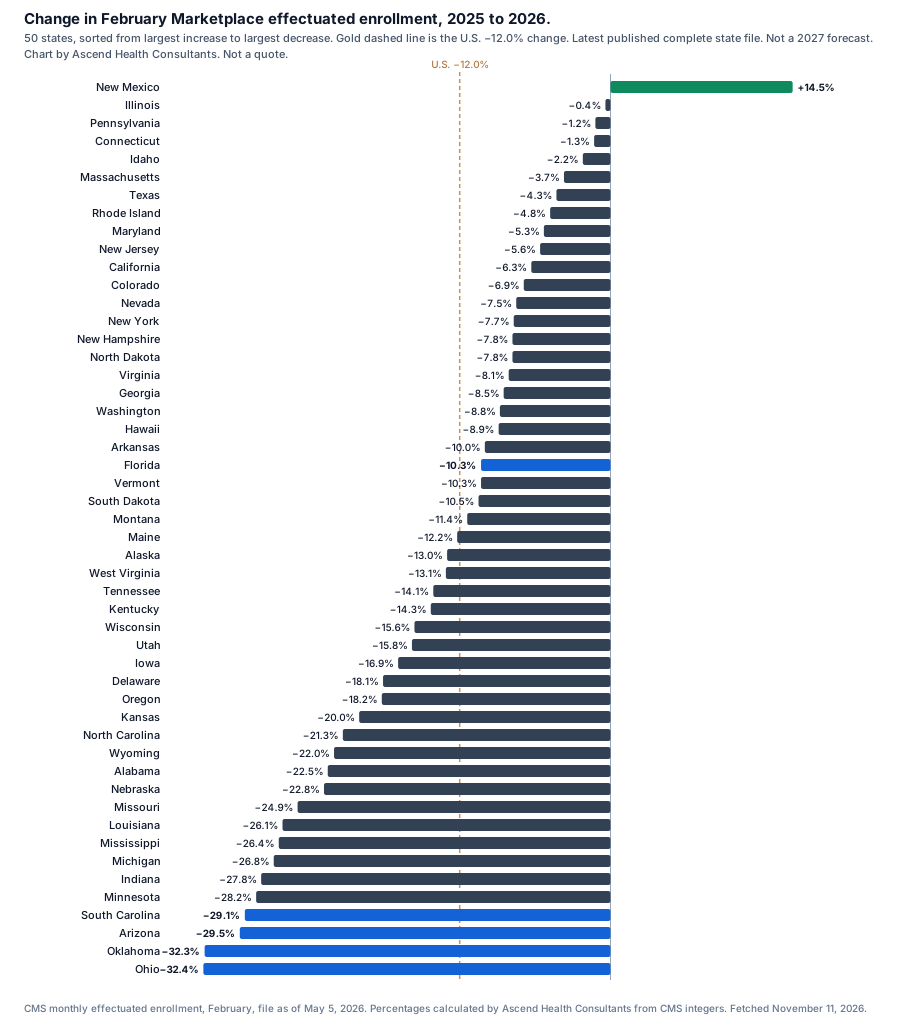
- Enhanced premium tax credits expired at the end of 2025. In the first year after that, CMS February effectuated Marketplace enrollment fell from 21,776,626 in 2025 to 19,169,147 in 2026, a decline of 2,607,479 people, or 12.0% (calculated from CMS's published counts). KFF reports this as a 12% decline, from 21.8 million to 19.2 million (2.6 million people). New Mexico was the only state with an increase (+14.5%, from 69,915 to 80,047), after fully replacing the expired federal credits with state-funded subsidies; KFF says that assistance continues in 2027. The largest declines were in Ohio (−32.4%) and Oklahoma (−32.3%). KFF also reports that, on average, premium payments net of tax credits increased by 58% for people who signed up for 2026 coverage, and that the February effectuation rate fell from 90% in 2025 to 83% in 2026. These are 2026 observed figures — the latest published complete state-by-state enrollment — not a 2027 enrollment forecast. A complete official 2027 enrollment file does not exist yet; Open Enrollment for 2027 coverage is still underway (November 1, 2026–January 15, 2027 on HealthCare.gov). Sources: CMS Health Insurance Exchanges Monthly Effectuated Enrollment, CSV as of May 5, 2026 (landing page and file dated as of May 5, 2026); KFF, How Has ACA Marketplace Enrollment Changed Across States in 2026? (July 28, 2026; 12% rounded decline, 58% net-payment figure, and 90% to 83% effectuation rate); KFF, 9 Things to Watch for the 2027 ACA Open Enrollment Period (2.6 million / 12% rounded decline, and New Mexico's 2027 subsidy continuation); KFF, What We Know So Far About 2026 ACA Marketplace Enrollment, Premiums, and Deductibles (May 19, 2026; also reports the 58% figure, from $113 to $178 a month).
Also, from CMS, not a finding about unsubsidized 40-year-old premiums: the CMS Plan Year 2027 Marketplace Plans and Prices Fact Sheet (October 30, 2026) says more than 75% of Americans who purchase coverage through HealthCare.gov will continue to have access to premiums at or below $50 in 2027, and that, on average, shoppers have access to 100 plans and five to six insurance companies. These figures describe access after tax credits and plan choice on HealthCare.gov; they are not the unsubsidized 40-year-old benchmark and they do not cover state-based Marketplaces.
KFF updated the 2027 averages on November 6, 2026, “to accurately reflect data from Oregon and California.” The premium figures on this page were fetched from KFF on November 11, 2026, after that correction. Enrollment figures were fetched from the CMS file dated as of May 5, 2026, on November 11, 2026.
ACA premiums in 2027, and 2027 health insurance premiums
People searching for "ACA premiums 2027" or "2027 health insurance premiums" are usually looking at Marketplace (ACA) rate changes. The figures on this page come from KFF and are explained in the key findings above. In brief, and using only those verified sources:
- KFF's average U.S. Marketplace benchmark premium for a 40-year-old, before subsidies, is $703 a month in 2027, compared with $625 in 2026. Calculated from those published integers, that is a 12.5% change. KFF's November 6, 2026 brief describes the average increase as 13%. This page reports both, and uses 12.5% when we calculate from the corrected integers (KFF corrected the national benchmark from $704 to $703 on November 6, 2026).
- The same KFF brief says insurers had proposed a median increase of 15%, and that 2027 is a second consecutive year of double-digit proposed increases (benchmark premiums rose 26% from 2025 to 2026, which is KFF's published wording; from KFF's 40-year-old averages of $497 in 2025 and $625 in 2026, the calculated change is 25.8%).
- KFF says HealthCare.gov states' 2027 benchmark premiums are increasing 11%, and states that run their own enrollment platforms are seeing 16%. From 2025 to 2027, KFF says benchmark silver premiums increased 42% on average (41.4% when calculated from the $497 and $703 integers).
These are national and state-average figures for unsubsidized benchmark silver premiums. What a household pays depends on the plan, the county, age, and any federal premium tax credit or state premium help. If a Marketplace quote is higher than you expected, a licensed agent can also compare private plan options.
State-by-state index
Every dollar figure in the premium columns is KFF's published average. The dollar change and percent change columns are calculated by us from those integers, as described in the methodology. Enrollment columns are CMS February effectuated enrollment for 2025 and 2026 — the latest published complete state file, not a 2027 forecast. Jump to a location, or download the CSV.
| Location | 2026 benchmark | 2027 benchmark | $ change | % change | 2027 lowest-cost bronze | 2027 lowest-cost silver | 2027 lowest-cost gold | Feb 2025 effectuated enrollment | Feb 2026 effectuated enrollment | Enrollment % change | 2027 state subsidy (if published) |
|---|---|---|---|---|---|---|---|---|---|---|---|
| United States | $625 | $703 | +$78 | +12.5% | $511 | $681 | $694 | 21,776,626 | 19,169,147 | −12.0% | — |
| Florida | $683 | $738 | +$55 | +8.1% | $555 | $723 | $711 | 4,292,372 | 3,849,587 | −10.3% | — |
| Alabama | $645 | $712 | +$67 | +10.4% | $463 | $698 | $764 | 418,815 | 324,504 | −22.5% | — |
| Alaska | $1,032 | $1,284 | +$252 | +24.4% | $796 | $1,119 | $1,014 | 27,052 | 23,546 | −13.0% | — |
| Arizona | $532 | $609 | +$77 | +14.5% | $465 | $604 | $748 | 363,110 | 255,927 | −29.5% | — |
| Arkansas | $774 | $757 | −$17 | −2.2% | $450 | $718 | $659 | 144,140 | 129,699 | −10.0% | — |
| California | $570 | $633 | +$63 | +11.1% | $471 | $568 | $608 | 1,971,965 | 1,847,315 | −6.3% | Continuing; expanded to 165–200% FPL |
| Colorado | $557 | $615 | +$58 | +10.4% | $473 | $589 | $564 | 260,973 | 242,970 | −6.9% | — |
| Connecticut | $870 | $1,005 | +$135 | +15.5% | $669 | $824 | $894 | 150,483 | 148,596 | −1.3% | — |
| Delaware | $691 | $876 | +$185 | +26.8% | $663 | $869 | $821 | 44,290 | 36,282 | −18.1% | — |
| Georgia | $615 | $733 | +$118 | +19.2% | $572 | $722 | $785 | 1,298,071 | 1,188,140 | −8.5% | — |
| Hawaii | $541 | $592 | +$51 | +9.4% | $448 | $568 | $597 | 23,025 | 20,974 | −8.9% | — |
| Idaho | $490 | $553 | +$63 | +12.9% | $369 | $531 | $575 | 116,478 | 113,957 | −2.2% | — |
| Illinois | $646 | $707 | +$61 | +9.4% | $479 | $695 | $613 | 423,727 | 421,852 | −0.4% | — |
| Indiana | $474 | $537 | +$63 | +13.3% | $476 | $536 | $733 | 281,215 | 203,119 | −27.8% | — |
| Iowa | $501 | $528 | +$27 | +5.4% | $371 | $513 | $504 | 124,311 | 103,253 | −16.9% | — |
| Kansas | $670 | $748 | +$78 | +11.6% | $582 | $728 | $776 | 179,920 | 143,880 | −20.0% | — |
| Kentucky | $590 | $667 | +$77 | +13.1% | $512 | $663 | $793 | 90,443 | 77,526 | −14.3% | — |
| Louisiana | $646 | $730 | +$84 | +13.0% | $502 | $722 | $769 | 264,790 | 195,759 | −26.1% | — |
| Maine | $709 | $804 | +$95 | +13.4% | $581 | $785 | $836 | 62,381 | 54,800 | −12.2% | — |
| Maryland | $414 | $491 | +$77 | +18.6% | $293 | $459 | $454 | 235,924 | 223,483 | −5.3% | — |
| Massachusetts | $494 | $551 | +$57 | +11.5% | $470 | $524 | $695 | 351,117 | 338,197 | −3.7% | — |
| Michigan | $523 | $595 | +$72 | +13.8% | $430 | $573 | $608 | 488,139 | 357,350 | −26.8% | — |
| Minnesota | $448 | $525 | +$77 | +17.2% | $417 | $506 | $570 | 145,967 | 104,788 | −28.2% | — |
| Mississippi | $662 | $814 | +$152 | +23.0% | $700 | $795 | $980 | 260,289 | 191,631 | −26.4% | — |
| Missouri | $605 | $675 | +$70 | +11.6% | $510 | $674 | $649 | 347,424 | 260,999 | −24.9% | — |
| Montana | $692 | $889 | +$197 | +28.5% | $599 | $842 | $807 | 72,195 | 63,975 | −11.4% | — |
| Nebraska | $710 | $780 | +$70 | +9.9% | $632 | $765 | $816 | 130,407 | 100,622 | −22.8% | — |
| Nevada | $497 | $565 | +$68 | +13.7% | $440 | $564 | $711 | 107,749 | 99,663 | −7.5% | — |
| New Hampshire | $401 | $486 | +$85 | +21.2% | $384 | $471 | $599 | 62,584 | 57,716 | −7.8% | — |
| New Jersey | $545 | $665 | +$120 | +22.0% | $515 | $643 | $876 | 499,872 | 471,801 | −5.6% | Maintained for 2027 |
| New Mexico | $623 | $725 | +$102 | +16.4% | $507 | $685 | $643 | 69,915 | 80,047 | +14.5% | Continuing full backfill in 2027 |
| New York | $817 | $1,041 | +$224 | +27.4% | $672 | $880 | $1,135 | 201,997 | 186,497 | −7.7% | — |
| North Carolina | $638 | $660 | +$22 | +3.4% | $546 | $651 | $721 | 774,226 | 609,544 | −21.3% | — |
| North Dakota | $570 | $610 | +$40 | +7.0% | $450 | $599 | $609 | 40,650 | 37,472 | −7.8% | — |
| Ohio | $513 | $603 | +$90 | +17.5% | $464 | $596 | $646 | 497,443 | 336,058 | −32.4% | — |
| Oklahoma | $604 | $686 | +$82 | +13.6% | $543 | $679 | $692 | 265,157 | 179,600 | −32.3% | — |
| Oregon | $543 | $656 | +$113 | +20.8% | $528 | $645 | $736 | 129,546 | 105,911 | −18.2% | — |
| Pennsylvania | $572 | $648 | +$76 | +13.3% | $426 | $628 | $546 | 478,353 | 472,627 | −1.2% | — |
| Rhode Island | $506 | $629 | +$123 | +24.3% | $388 | $587 | $564 | 41,994 | 39,991 | −4.8% | New for 2027 |
| South Carolina | $564 | $702 | +$138 | +24.5% | $508 | $688 | $712 | 546,335 | 387,145 | −29.1% | — |
| South Dakota | $655 | $704 | +$49 | +7.5% | $516 | $699 | $730 | 51,268 | 45,888 | −10.5% | — |
| Tennessee | $711 | $796 | +$85 | +12.0% | $547 | $775 | $782 | 513,772 | 441,515 | −14.1% | — |
| Texas | $661 | $737 | +$76 | +11.5% | $485 | $723 | $643 | 3,423,543 | 3,277,198 | −4.3% | — |
| Utah | $640 | $716 | +$76 | +11.9% | $536 | $661 | $749 | 400,330 | 337,266 | −15.8% | — |
| Vermont | $1,299 | $1,313 | +$14 | +1.1% | $859 | $1,299 | $1,188 | 32,287 | 28,968 | −10.3% | — |
| Virginia | $455 | $549 | +$94 | +20.7% | $403 | $545 | $518 | 368,519 | 338,768 | −8.1% | New for 2027 |
| Washington | $612 | $768 | +$156 | +25.5% | $468 | $733 | $600 | 296,073 | 269,993 | −8.8% | — |
| West Virginia | $1,073 | $1,185 | +$112 | +10.4% | $868 | $1,158 | $1,061 | 56,962 | 49,508 | −13.1% | — |
| Wisconsin | $611 | $720 | +$109 | +17.8% | $530 | $712 | $788 | 291,329 | 245,753 | −15.6% | — |
| Wyoming | $1,090 | $1,190 | +$100 | +9.2% | $875 | $1,190 | $1,076 | 44,267 | 34,514 | −22.0% | — |
| District of Columbia | $610 | $678 | +$68 | +11.1% | $555 | $627 | $723 | 13,432 | 12,973 | −3.4% | — |
KFF also publishes a figure for the District of Columbia. It is included because it is in KFF's table, and CMS publishes a District enrollment count in the same file. It is not a statement about where our agents are licensed. Our agents are licensed in all 50 states, not the District of Columbia.
More official figures (2025 benchmarks and 2026 Open Enrollment APTC averages)
These columns are official published averages, but they are easy to mix up with the 40-year-old 2027 benchmark in the primary table, so they live here. The 2025 benchmark is KFF’s figure for a 40-year-old, before subsidies. The Open Enrollment 2026 premium and APTC columns are KFF restatements of CMS plan-selection averages for all ages; they are not 2027 figures and they are not the 40-year-old benchmark. A complete 2027 state-by-state insurer-count table was not published; 2026 insurer counts from KFF are in the downloadable CSV. The 2027 enhanced-subsidy dollar-impact column in that CSV is intentionally blank: no official statewide 40-year-old 2027 net-premium figure was published.
| Location | 2025 benchmark | 2025–2027 $ change | 2025–2027 % change | OE 2026 average premium (all ages) | OE 2026 average premium after APTC | OE 2026 average APTC among recipients | OE 2026 average premium after APTC among recipients |
|---|---|---|---|---|---|---|---|
| United States | $497 | +$206 | +41.4% | $741 | $178 | $650 | $96 |
| Florida | $515 | +$223 | +43.3% | $806 | $106 | $740 | $62 |
| Alabama | $535 | +$177 | +33.1% | $743 | $126 | $678 | $70 |
| Alaska | $1,045 | +$239 | +22.9% | $1,043 | $344 | $947 | $114 |
| Arizona | $410 | +$199 | +48.5% | $688 | $229 | $555 | $133 |
| Arkansas | $458 | +$299 | +65.3% | $839 | $162 | $779 | $79 |
| California | $512 | +$121 | +23.6% | $737 | $264 | $579 | $165 |
| Colorado | $463 | +$152 | +32.8% | $673 | $318 | $511 | $187 |
| Connecticut | $693 | +$312 | +45.0% | $1,030 | $277 | $952 | $100 |
| Delaware | $534 | +$342 | +64.0% | $901 | $320 | $720 | $172 |
| Georgia | $493 | +$240 | +48.7% | $777 | $164 | $688 | $89 |
| Hawaii | $493 | +$99 | +20.1% | $778 | $372 | $568 | $243 |
| Idaho | $436 | +$117 | +26.8% | $509 | $202 | $402 | $108 |
| Illinois | $474 | +$233 | +49.2% | $816 | $230 | $688 | $142 |
| Indiana | $382 | +$155 | +40.6% | $623 | $222 | $481 | $137 |
| Iowa | $429 | +$99 | +23.1% | $615 | $235 | $499 | $134 |
| Kansas | $513 | +$235 | +45.8% | $779 | $160 | $697 | $80 |
| Kentucky | $442 | +$225 | +50.9% | $797 | $288 | $634 | $168 |
| Louisiana | $524 | +$206 | +39.3% | $759 | $144 | $674 | $82 |
| Maine | $546 | +$258 | +47.3% | $913 | $340 | $769 | $178 |
| Maryland | $365 | +$126 | +34.5% | $542 | $284 | $384 | $181 |
| Massachusetts | $447 | +$104 | +23.3% | $594 | $325 | $371 | $219 |
| Michigan | $404 | +$191 | +47.3% | $657 | $222 | $536 | $127 |
| Minnesota | $363 | +$162 | +44.6% | $639 | $437 | $409 | $284 |
| Mississippi | $485 | +$329 | +67.8% | $816 | $131 | $718 | $94 |
| Missouri | $489 | +$186 | +38.0% | $724 | $173 | $638 | $90 |
| Montana | $554 | +$335 | +60.5% | $729 | $230 | $643 | $107 |
| Nebraska | $600 | +$180 | +30.0% | $800 | $217 | $674 | $120 |
| Nevada | $414 | +$151 | +36.5% | $659 | $234 | $516 | $148 |
| New Hampshire | $325 | +$161 | +49.5% | $553 | $342 | $378 | $200 |
| New Jersey | $492 | +$173 | +35.2% | $734 | $277 | $556 | $185 |
| New Mexico | $515 | +$210 | +40.8% | $842 | $299 | $659 | $196 |
| New York | $790 | +$251 | +31.8% | $812 | $636 | $422 | $376 |
| North Carolina | $507 | +$153 | +30.2% | $755 | $180 | $660 | $97 |
| North Dakota | $537 | +$73 | +13.6% | $591 | $229 | $462 | $126 |
| Ohio | $441 | +$162 | +36.7% | $665 | $233 | $523 | $131 |
| Oklahoma | $501 | +$185 | +36.9% | $727 | $161 | $624 | $98 |
| Oregon | $510 | +$146 | +28.6% | $741 | $426 | $525 | $253 |
| Pennsylvania | $461 | +$187 | +40.6% | $742 | $251 | $616 | $145 |
| Rhode Island | $425 | +$204 | +48.0% | $649 | $246 | $491 | $166 |
| South Carolina | $471 | +$231 | +49.0% | $655 | $139 | $579 | $76 |
| South Dakota | $619 | +$85 | +13.7% | $684 | $211 | $568 | $118 |
| Tennessee | $516 | +$280 | +54.3% | $838 | $141 | $772 | $67 |
| Texas | $489 | +$248 | +50.7% | $709 | $89 | $667 | $41 |
| Utah | $547 | +$169 | +30.9% | $571 | $120 | $499 | $68 |
| Vermont | $1,277 | +$36 | +2.8% | $1,090 | $364 | $947 | $183 |
| Virginia | $372 | +$177 | +47.6% | $575 | $215 | $461 | $124 |
| Washington | $434 | +$334 | +77.0% | $738 | $343 | $612 | $146 |
| West Virginia | $919 | +$266 | +28.9% | $1,314 | $208 | $1,244 | $80 |
| Wisconsin | $495 | +$225 | +45.5% | $784 | $250 | $681 | $123 |
| Wyoming | $871 | +$319 | +36.6% | $1,217 | $235 | $1,127 | $88 |
| District of Columbia | $578 | +$100 | +17.3% | $815 | $725 | $480 | $398 |
How to read Florida's numbers
Florida's 2027 average benchmark ($738) is above the U.S. average ($703), while Florida's year-over-year percentage change (8.1%) is below the U.S. average change (12.5%). These are statewide, county-weighted averages for a 40-year-old, before subsidies. They are not a premium for Tampa, St. Petersburg, or any other county, and they are not a quote. County-level official files live on data.healthcare.gov; this version of the index stays with KFF's state published averages so every figure can be checked against a single public table.
The first year after enhanced tax credits expired
Enhanced premium tax credits, first enacted in 2021 and extended through 2025, expired at the end of 2025. Starting in January 2026, premium tax credits again follow the pre-2021 income rules (generally 100%–400% of the federal poverty level). That is a statutory fact, not a forecast. (KFF APTC indicator notes; KFF, 9 Things to Watch for the 2027 ACA Open Enrollment Period.)
In the first year after expiration, CMS February effectuated Marketplace enrollment fell from 21,776,626 (2025) to 19,169,147 (2026), or 12.0%. New Mexico, which fully replaced the expired federal credits with state-funded subsidies, was the only state with an increase (69,915 to 80,047, +14.5%). KFF says New Mexico is continuing that assistance in 2027, and that California, New Jersey, Rhode Island, and Virginia also have 2027 state-funded subsidy programs of varying scope. KFF did not publish a complete 50-state list of 2027 dollar amounts, so this page does not invent them.
KFF reports that premium payments net of tax credits increased by 58% on average for people who signed up for 2026 coverage, and that the share of open-enrollment sign-ups that were still effectuated in February fell from 90% in 2025 to 83% in 2026. Insurers, in KFF's analysis of filings, estimated that risk-pool changes after the expiration added about four percentage points on average to premiums in 2026 and expect a similar additional effect in 2027.
2027 enrollment is not yet an official complete file. Open Enrollment for 2027 HealthCare.gov coverage runs November 1, 2026 through January 15, 2027. This section will need a new CMS source after 2027 effectuated enrollment is published.
What this index is not
- It is not a quote from Ascend Health Consultants or from any carrier.
- It is not the amount a household will pay after premium tax credits, and it is not a premium for any age other than the 40-year-old used in KFF's table.
- It does not describe private plans. Private plans can be reviewed year-round and are a separate path from Marketplace coverage.
Methodology
Premiums (KFF). We copied KFF's published state and U.S. averages for 2025, 2026, and 2027 from KFF, Average Monthly Marketplace Premiums by Metal Tier on November 11, 2026. The 2027 benchmark column matches KFF's Marketplace Average Monthly Benchmark Premiums indicator, opened the same day. KFF's notes, quoted below, still apply.
Correction: The average 2027 premium data in this table was updated on November 6, 2026 to accurately reflect data from Oregon and California. Premiums are monthly and may include premiums for non-essential health benefits. Premiums were analyzed using the lowest-cost premium for each metal tier (bronze, silver, and gold) and the second-lowest-cost silver (benchmark) premium for a 40-year-old in each county and weighted by county plan selections. In some state-based marketplaces, the premium data for some years are at the rating area level or zip level and are mapped to counties before weighting by county plan selections.
Sources: KFF analysis of data from Healthcare.gov, state rate review websites, state plan finder tools, and state provided data.
Calculated premium columns. Dollar change = later-year average benchmark − earlier-year average benchmark. Percent change = dollar change ÷ earlier-year average benchmark × 100, rounded to one decimal place. We did not adjust KFF's integers. The 12.5% U.S. 2026-to-2027 figure is (703 − 625) ÷ 625. The 41.4% 2025-to-2027 figure is (703 − 497) ÷ 497. When KFF itself rounds these as “13%” and “42%,” we report both KFF's wording and the calculation from the integers.
Enrollment (CMS). February effectuated enrollment comes from the CMS Health Insurance Exchanges Monthly Effectuated Enrollment public file dated as of May 5, 2026 (CSV as of May 5, 2026), fetched November 11, 2026. The U.S. row is CMS's Total / All platforms. State rows use each state's February count (Illinois appears as HealthCare.gov in 2025 and SBE in 2026; KFF notes the platform switch). Percent change is calculated from those integers, same rounding. KFF's July 28, 2026 enrollment analysis uses the same CMS file for 2026 (as of May 5, 2026) and reports rounded totals (21.8 million, 19.2 million, 12%). This page uses the exact CMS integers.
Open Enrollment 2026 APTC averages (KFF, from CMS). The expandable “more official figures” table and the CSV include KFF's Open Enrollment 2026 average premium, average premium after APTC, average APTC among recipients, and average premium after APTC among recipients, from the KFF Marketplace Average Premiums and Average APTC indicator. These are all-ages plan-selection averages for 2026, not 40-year-old benchmarks and not 2027 figures.
What we did not do. We did not estimate 2027 enrollment, 2027 insurer counts by state, or a 2027 statewide “expiration impact” dollar figure for a 40-year-old. We did not compute subsidies for sample households. We did not turn county landscape files into new state averages (KFF already publishes state averages). 2026 insurer participation counts from KFF are in the downloadable CSV only; a complete 2027 state table was not published. If KFF or CMS later revises a table, re-check the integers against the live source and date the fetch.
How to cite this report
If you use these figures or the charts, a branded credit is enough. Please do not use keyword-stuffed anchor text. Underlying KFF and CMS figures remain theirs; their terms apply. Calculated columns, this page, and the charts are published so reporters can cite a stable URL.
Suggested citation
Ascend Health Consultants, 2027 State Health Insurance Cost Index, citing KFF State Health Facts, Average Monthly Marketplace Premiums by Metal Tier (fetched November 11, 2026, after KFF’s November 6, 2026 correction), and CMS Health Insurance Exchanges Monthly Effectuated Enrollment (February counts, file as of May 5, 2026). https://ascendhealthconsultants.com/state-health-insurance-cost-index-2027/
Short attribution line, for a chart caption or a news brief:
Source: Ascend Health Consultants, 2027 State Health Insurance Cost Index, citing KFF and CMS. https://ascendhealthconsultants.com/state-health-insurance-cost-index-2027/
Embed snippet (blockquote and a link back to this page; no external scripts):
Underlying KFF and CMS figures remain theirs; their terms apply. Calculated columns, this page, and the charts may be cited with attribution at the stable URL above.
Files you can reuse:
- CSV of the full table, including calculated columns, enrollment, Open Enrollment 2026 APTC averages, and a source URL on every row.
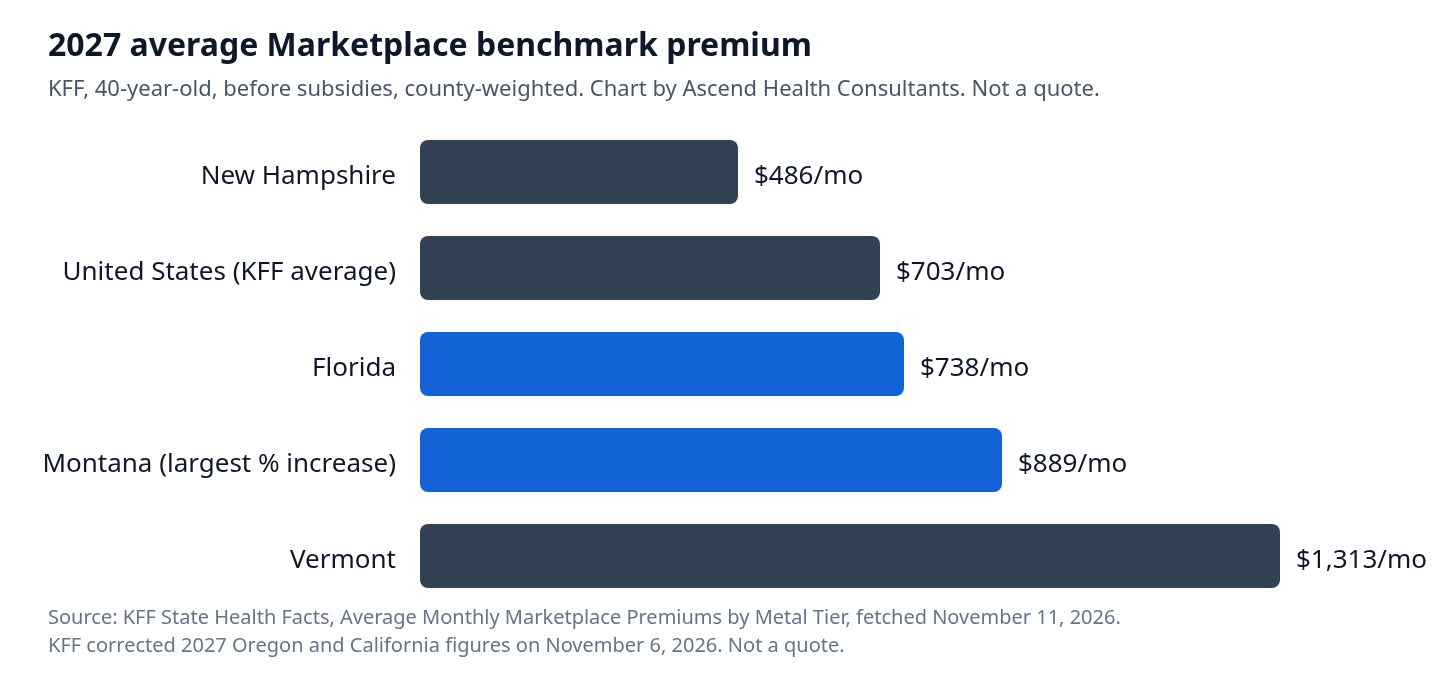
- SVG chart (and PNG) of selected 2027 benchmarks (lowest state, the U.S. average, Florida, Montana, and the highest state).
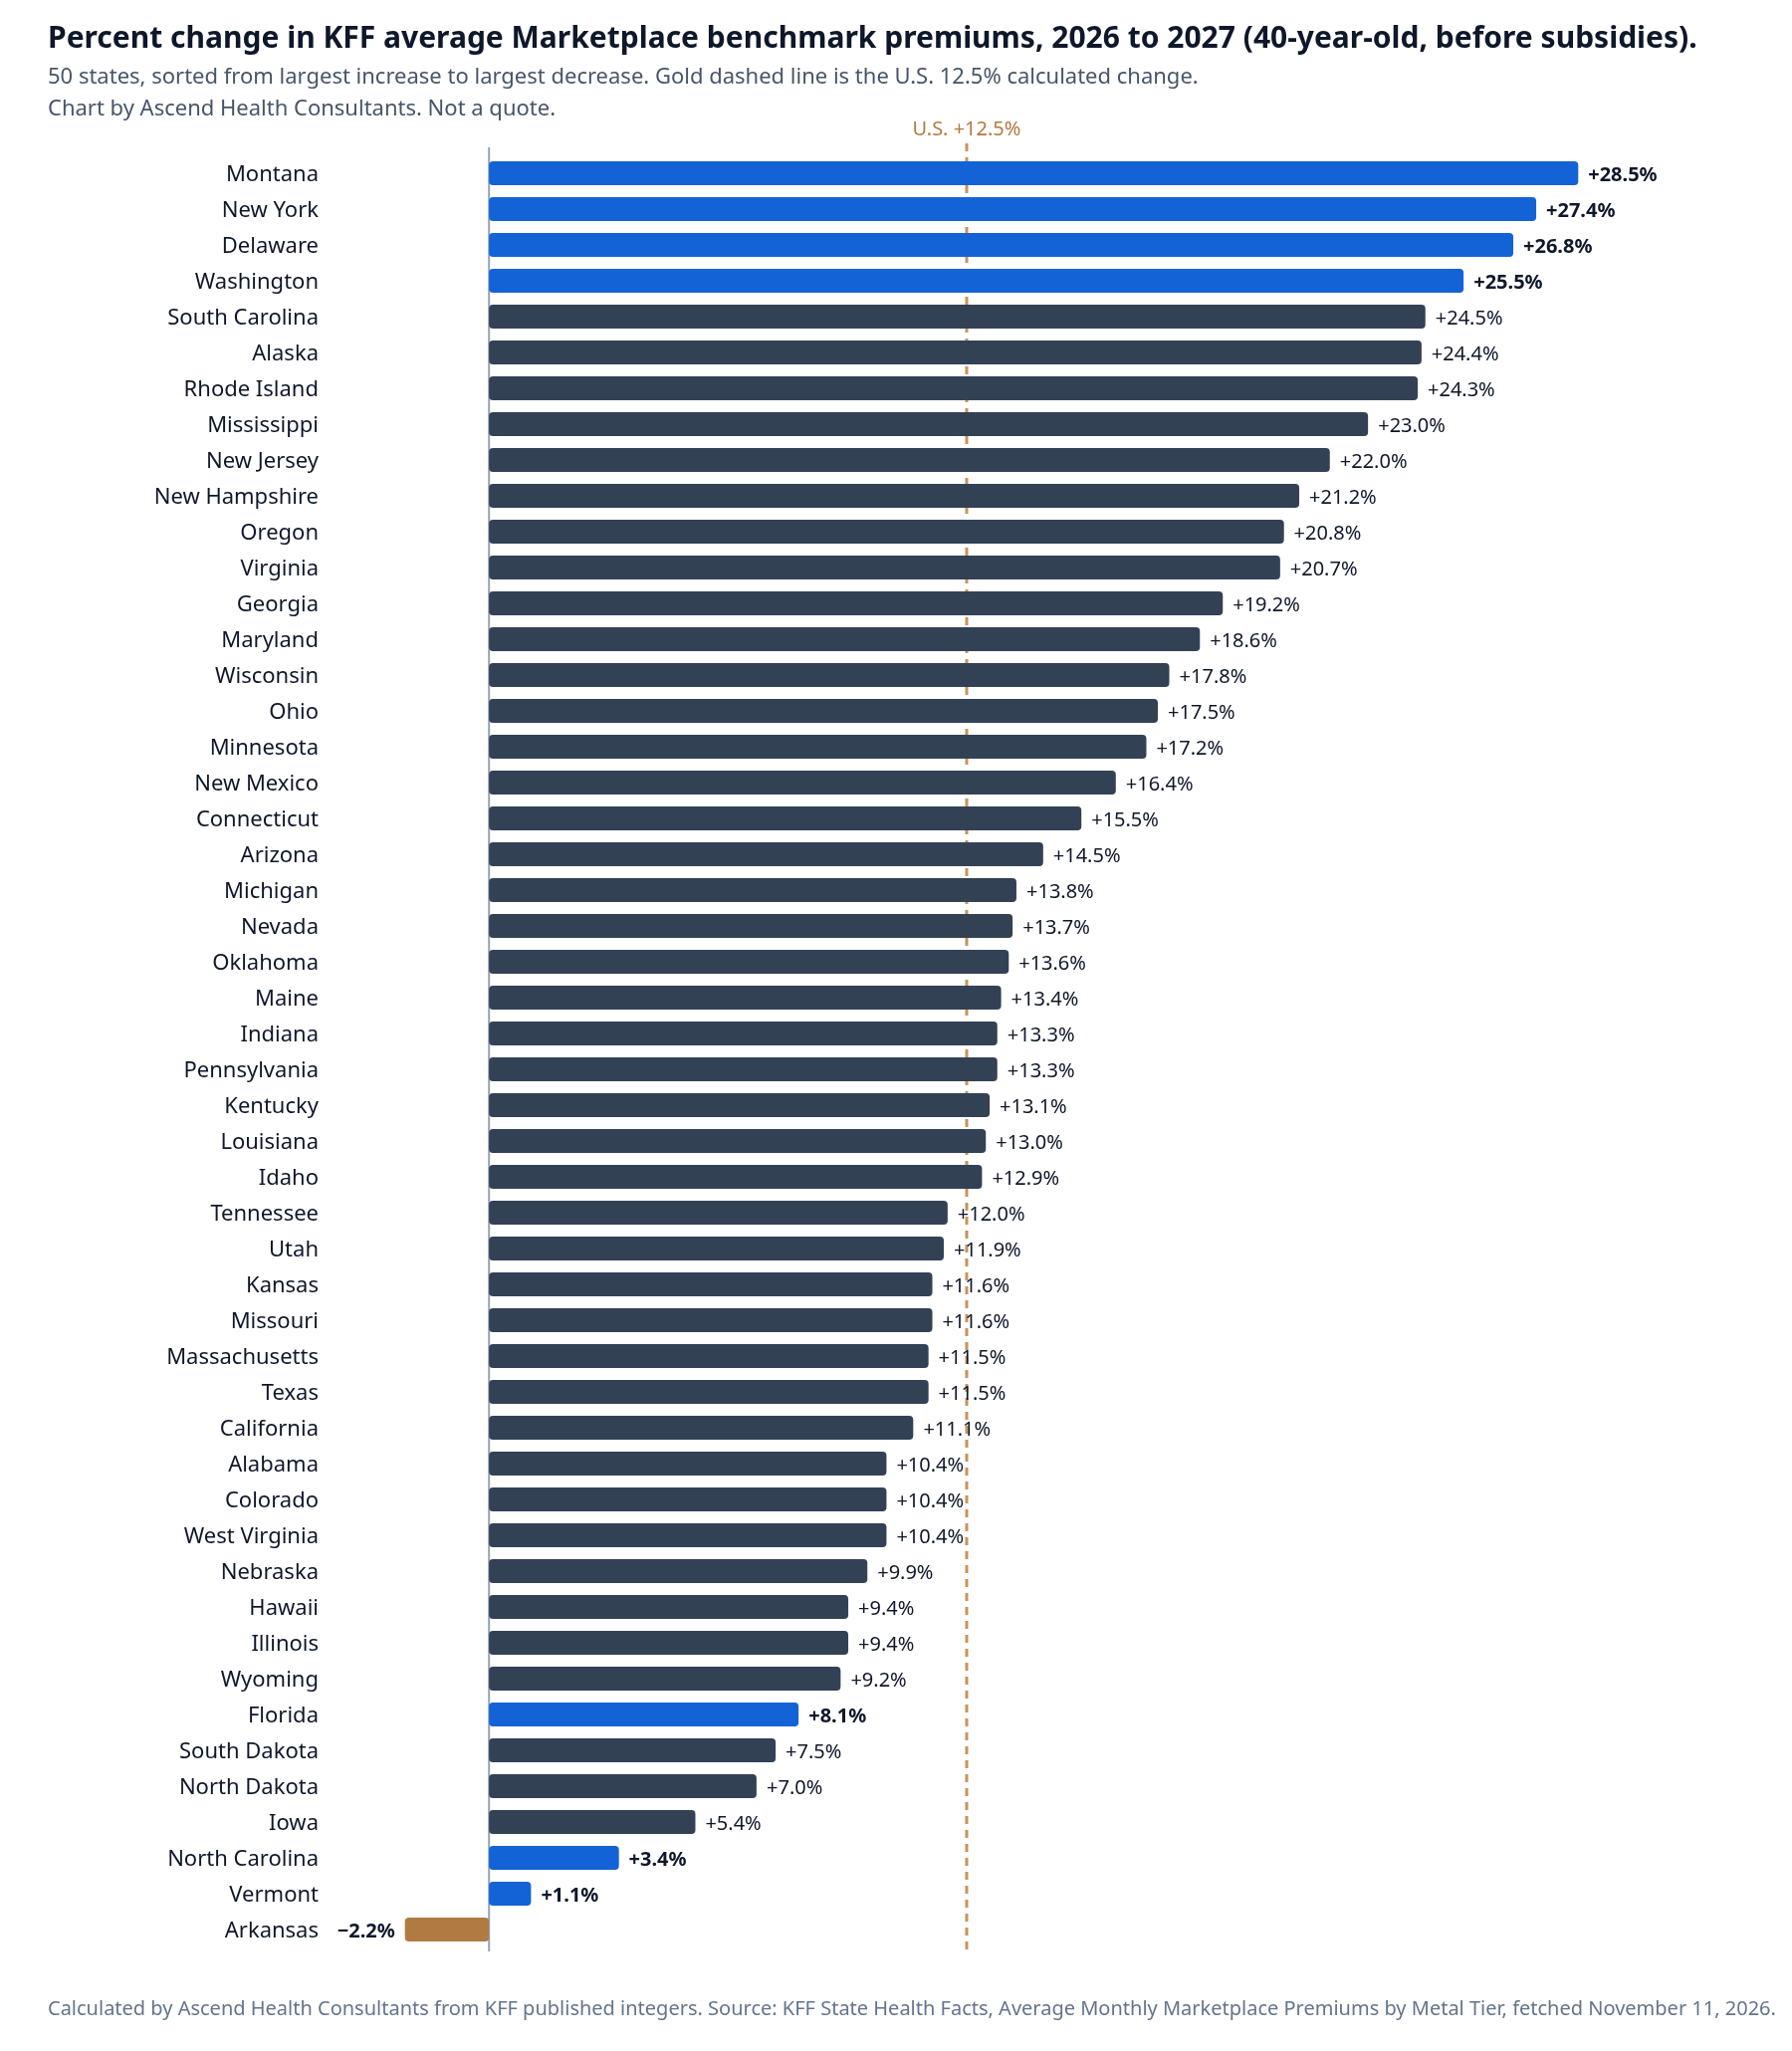
- SVG chart (and PNG) of 2026-to-2027 percent change in the average benchmark, all 50 states.
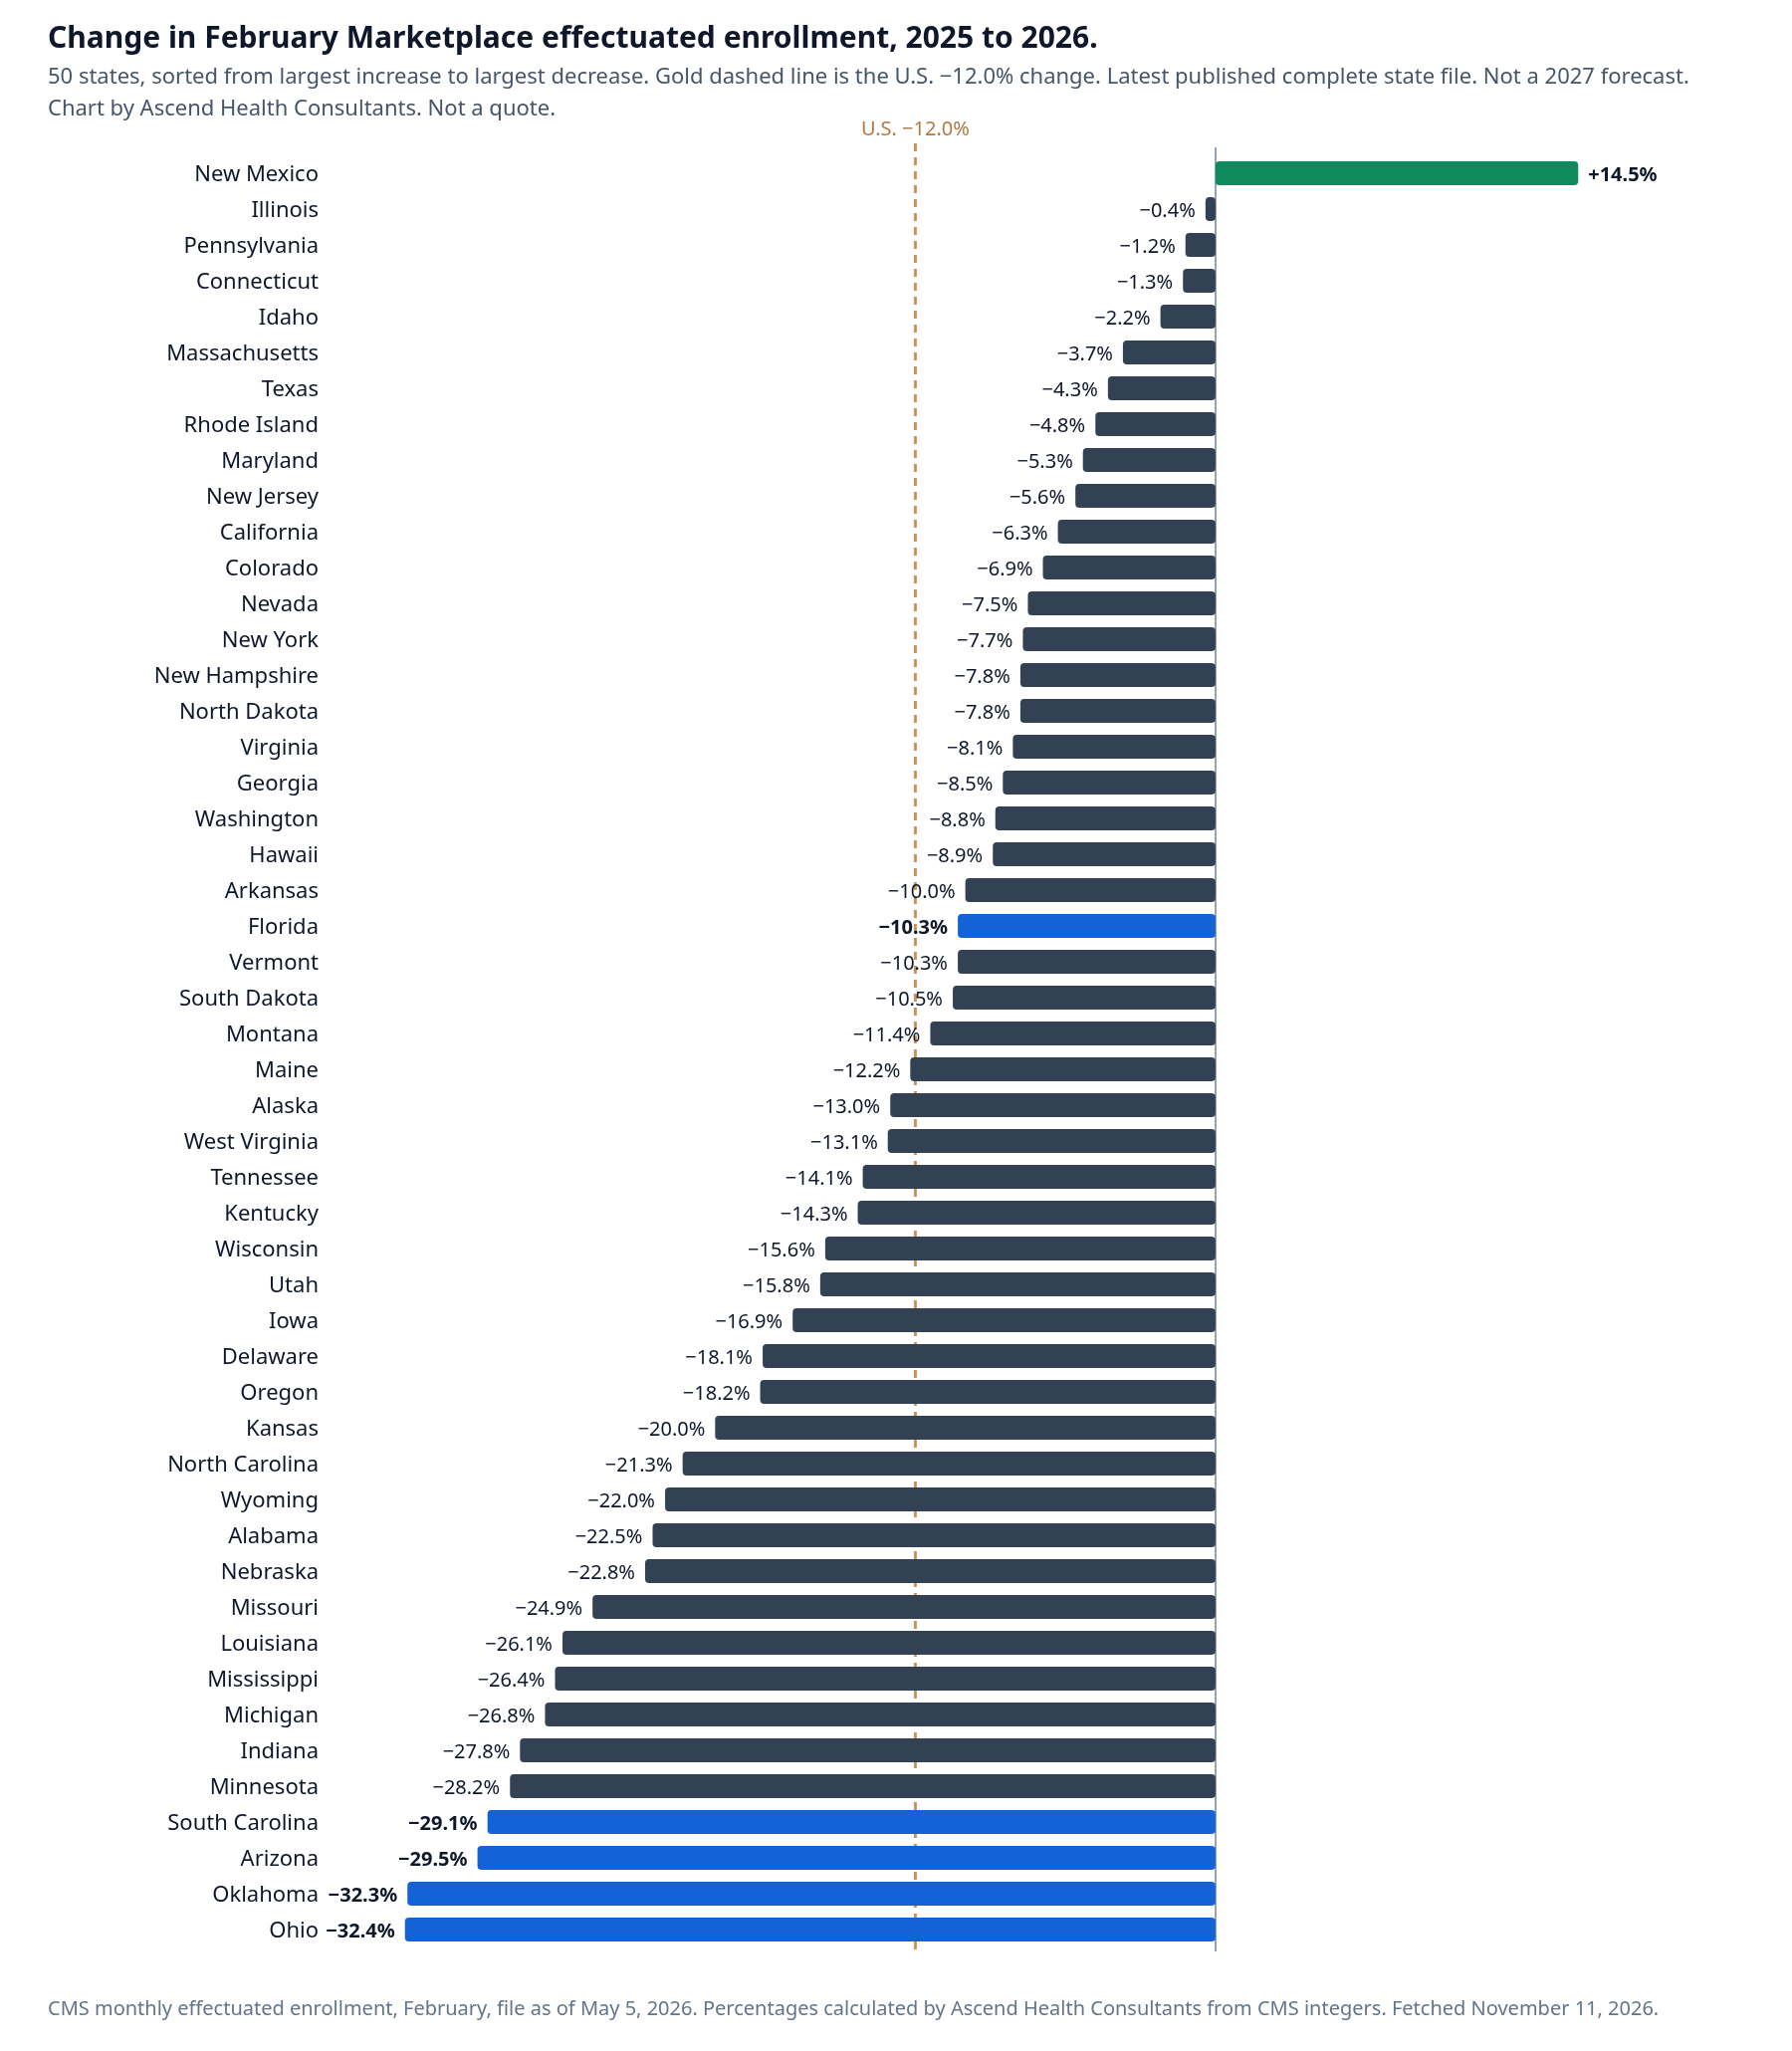
- SVG chart (and PNG) of 2025-to-2026 February effectuated enrollment change, all 50 states.
- ICS calendar of the official HealthCare.gov Open Enrollment dates for 2027 coverage.
Frequently asked questions
Are these prices for plans sold by Ascend Health Consultants?
No. These are KFF's published average Marketplace premiums for a 40-year-old, before subsidies. They are not a quote and not a plan price from any carrier we represent. Licensed agents can review private health plans and Marketplace options for a household's actual situation.
How much are ACA premiums increasing in 2027?
KFF's November 6, 2026 brief says the average increase in finalized benchmark silver premiums for 2027 is 13%, after insurers proposed a median 15% increase. This page also reports 12.5%, calculated from KFF's corrected average U.S. benchmark for a 40-year-old of $703 in 2027 and $625 in 2026. KFF says HealthCare.gov states are increasing 11% and state-run marketplaces 16%. See the key findings and the ACA premiums in 2027 section on this page for sources and the 12.5% versus 13% note.
What are 2027 health insurance premiums on the ACA Marketplace?
KFF's average U.S. Marketplace benchmark premium for a 40-year-old, before subsidies, is $703 a month in 2027. KFF's published U.S. average for the lowest-cost gold plan is $694, and this page also cites KFF's metal-tier table for state figures. What a person pays depends on location, age, the plan, and any premium tax credit. The figures are unsubsidized averages, not a quote.
Why is the U.S. average lowest-cost gold figure below the U.S. average benchmark?
KFF publishes each column as its own county-weighted average. The national average of lowest-cost gold plans can differ from the national average of benchmark silver plans because the averages are built separately. It is not a statement that gold coverage costs less than the benchmark silver plan in a given county. Use the county-level official files on data.healthcare.gov (HealthCare.gov states) if you need a local comparison, or talk with a licensed agent.
Does this include premium tax credits?
No. KFF's table is before subsidies. A household's net premium can be lower after premium tax credits, depending on income and eligibility. This page does not estimate those credits.
When is Open Enrollment for 2027 Marketplace coverage?
According to HealthCare.gov, Open Enrollment for 2027 HealthCare.gov coverage runs November 1, 2026 through January 15, 2027, and December 15 is the last day to enroll for coverage that starts January 1. State-based Marketplaces can set different dates. Private plans can be reviewed year-round.
Are your agents licensed in all 50 states?
Yes. Licensed agents working with Ascend Health Consultants are licensed in all 50 states, not the District of Columbia. You can call (813) 724-3314, Monday–Saturday, 8 AM–9 PM ET, Sunday closed.
Why does this page say 12.5% when KFF says 13%?
Because 12.5% is (703 − 625) ÷ 625, from KFF's corrected published integers. KFF's November 6, 2026 brief describes the average increase as 13% and, the same day, corrected the national benchmark from $704 to $703. We use the calculation from the corrected integers and note KFF's “13%” wording.
Did enhanced premium tax credits expire, and is that in these 2027 premiums?
The enhanced credits expired at the end of 2025. The 2026 and 2027 KFF benchmark columns are before subsidies; they are the advertised average premium, not the enrollee's net payment. The enrollment change we report is for 2026, the first year after expiration, from official CMS counts. A 2027 statewide dollar “impact” for a 40-year-old was not published, so we do not show one.
Are the enrollment numbers for 2027?
No. They are February effectuated enrollment for 2025 and 2026, from a CMS file dated as of May 5, 2026 — the latest complete official state file when this page was compiled (November 11, 2026). 2027 Open Enrollment is still underway. We will not invent a 2027 enrollment number.
What will a household actually pay?
That depends on income, household size, eligibility for premium tax credits, and the plan selected, and it can be lower than the benchmark after credits. This page does not estimate those credits. A licensed agent can review Marketplace options and private health plans for a household's actual situation. Call (813) 724-3314, Monday–Saturday, 8 AM–9 PM ET.
Can I get a private plan outside Open Enrollment?
Licensed agents can review private health plans year-round. Private plans are a separate path from Marketplace coverage. This index does not describe private-plan premiums.
Want help reading this for your situation?
A licensed agent can review private health plans and Marketplace options with you. We never charge a fee for our help.
Sources (checked November 11, 2026)
- KFF, Average Monthly Marketplace Premiums by Metal Tier (fetched November 11, 2026; KFF correction dated November 6, 2026)
- Marketplace Average Monthly Benchmark Premiums (fetched November 11, 2026; 2027 benchmark column matches the metal-tier table)
- KFF, 9 Things to Watch for the 2027 ACA Open Enrollment Period (published/corrected November 6, 2026)
- KFF, How Has ACA Marketplace Enrollment Changed Across States in 2026? (July 28, 2026)
- KFF, What We Know So Far About 2026 ACA Marketplace Enrollment, Premiums, and Deductibles (May 19, 2026; 58% average net premium-payment increase)
- CMS Health Insurance Exchanges Monthly Effectuated Enrollment — CSV as of May 5, 2026
- KFF, Marketplace Average Premiums and Average APTC — Open Enrollment 2026 (latest published; not 2027)
- KFF, Number of Insurers Participating in the Individual Health Insurance Marketplaces — 2026 (complete 2027 state table not published; 2026 counts are in the CSV)
- KFF, Tracking Insurer Participation Changes in the ACA Marketplaces in 2027 — October 28, 2026; national announcement counts only
- CMS Plan Year 2027 Marketplace Plans and Prices Fact Sheet — October 30, 2026
- HealthCare.gov, dates and deadlines
- CMS data.healthcare.gov — official HealthCare.gov plan files; county-level, not restated here
Dates, rules, and averages can be revised by the original publishers. Plan availability and eligibility are determined by the carrier or plan sponsor. Benefits are subject to the terms of the plan documents.